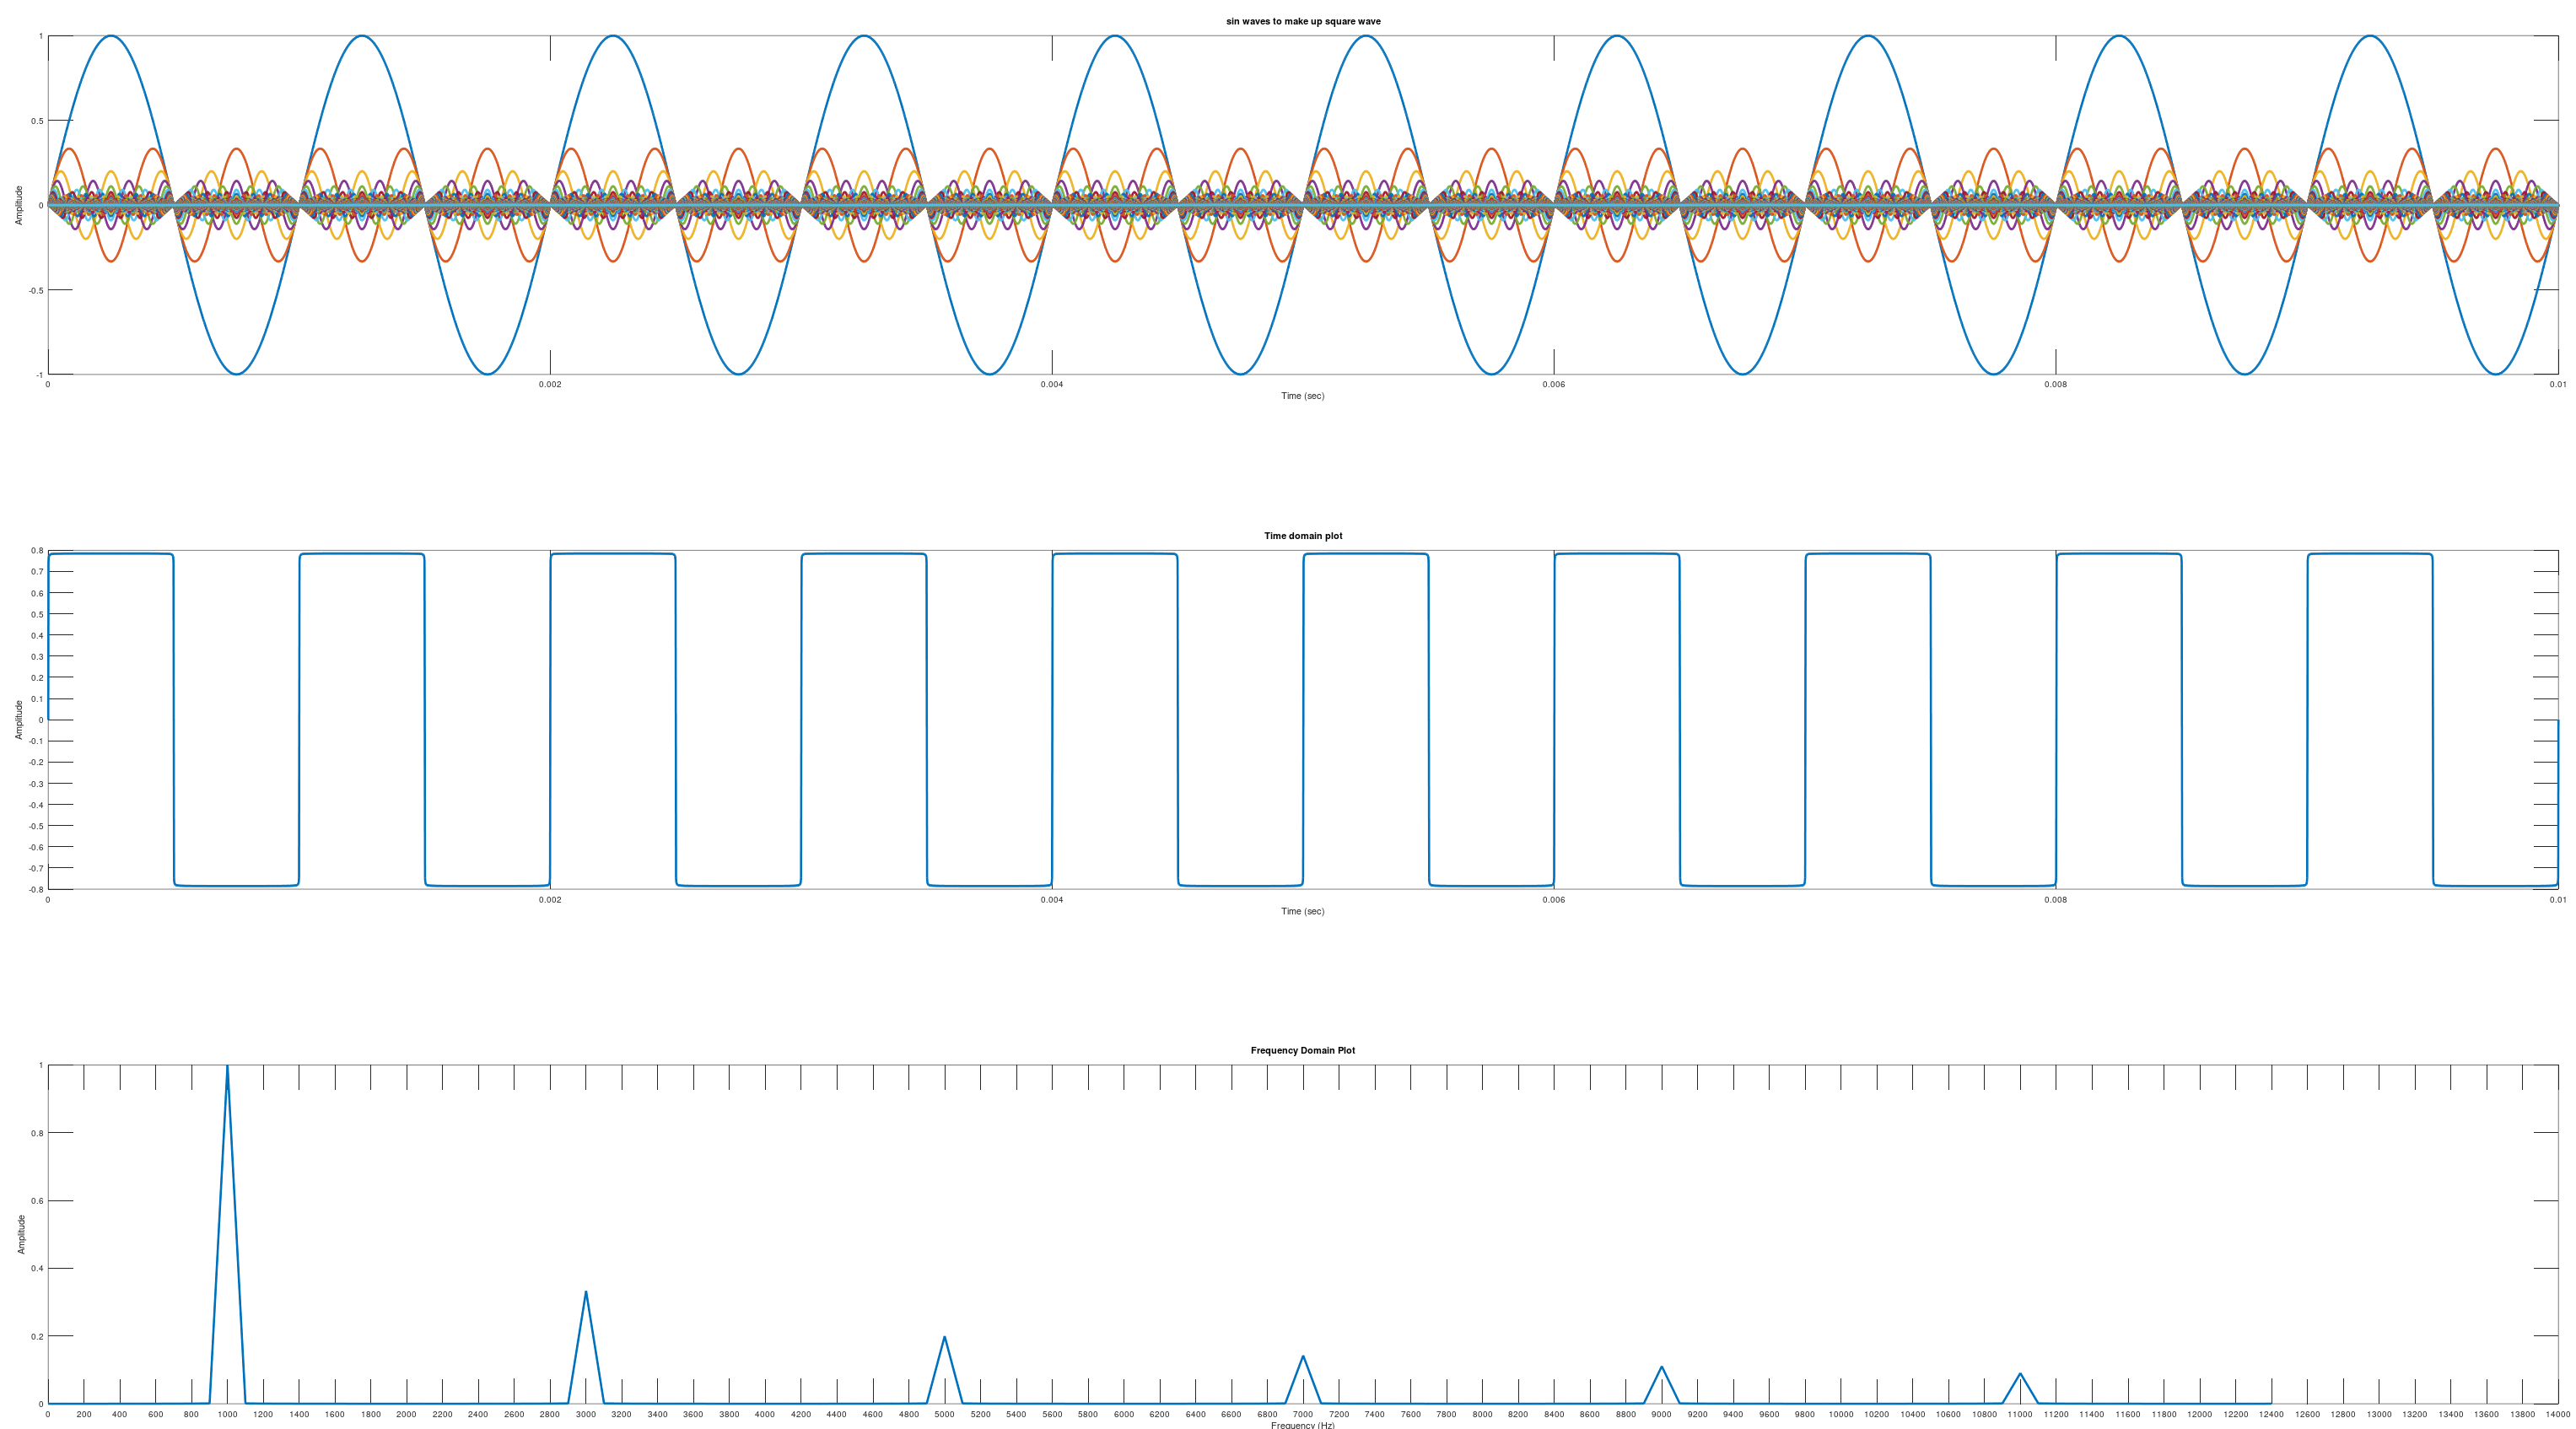
Did you know square waves as we know them are generated by summing a series of sine waves? In this blog I will provide a little square wave example written in octave.
clear;
pkg load signal
numberofsinewaves = 10;
frequency = 1000;
amplitude = 1;
samplingrate = (1/frequency)/1000;
samplingfrequncy = 1/samplingrate;
x = 0:samplingrate:(1/frequency)*10;
y = zeros(1,length(x));
yarray = zeros(10,length(x));
for k = 1:2:(numberofsinewaves*2)
  y = y + amplitude*sin(2*pi*frequency*x*k)/k;
  yarray((k+1)/2,:) = amplitude*sin(2*pi*frequency*x*k)/k;
end
#start time domain plot
subplot(311);
plot(x,yarray, "linewidth", 2);
xlabel('Time (sec)');
ylabel('Amplitude');
title('sin waves to make up square wave');
#end time domain plot
#start time domain plot
subplot(312);
plot(x,y, "linewidth", 2);
xlabel('Time (sec)');
ylabel('Amplitude');
title('Time domain plot');
#end time domain plot
x1 = 1:length(x);
for i = 1:length(x)
  x1(i) = (i-1)*samplingfrequncy/length(x);
endfor
y1temp = abs(fft(y));
y1 = 1:length(x);
sumsquare = 0;
for i = 1:length(x)
  #sumsquare += y1temp(i)^2;
  y1(i) = y1temp(i)/(0.5*length(y1temp));
endfor
set(gca, 'ytick', -1:0.1:1);
#start frequency domain plot
subplot(313);
plot(x1(1:length(x1)/80),y1(1:length(x1)/80), "linewidth", 2);
set(gca,'xtick',0:frequency/5:frequency*100);
xlabel('Frequency (Hz)');
ylabel('Amplitude');
title('Frequency Domain Plot');
#end frequency domain plot
Worth nothing the peak of the dominant wave is larger than the peak of the square wave.
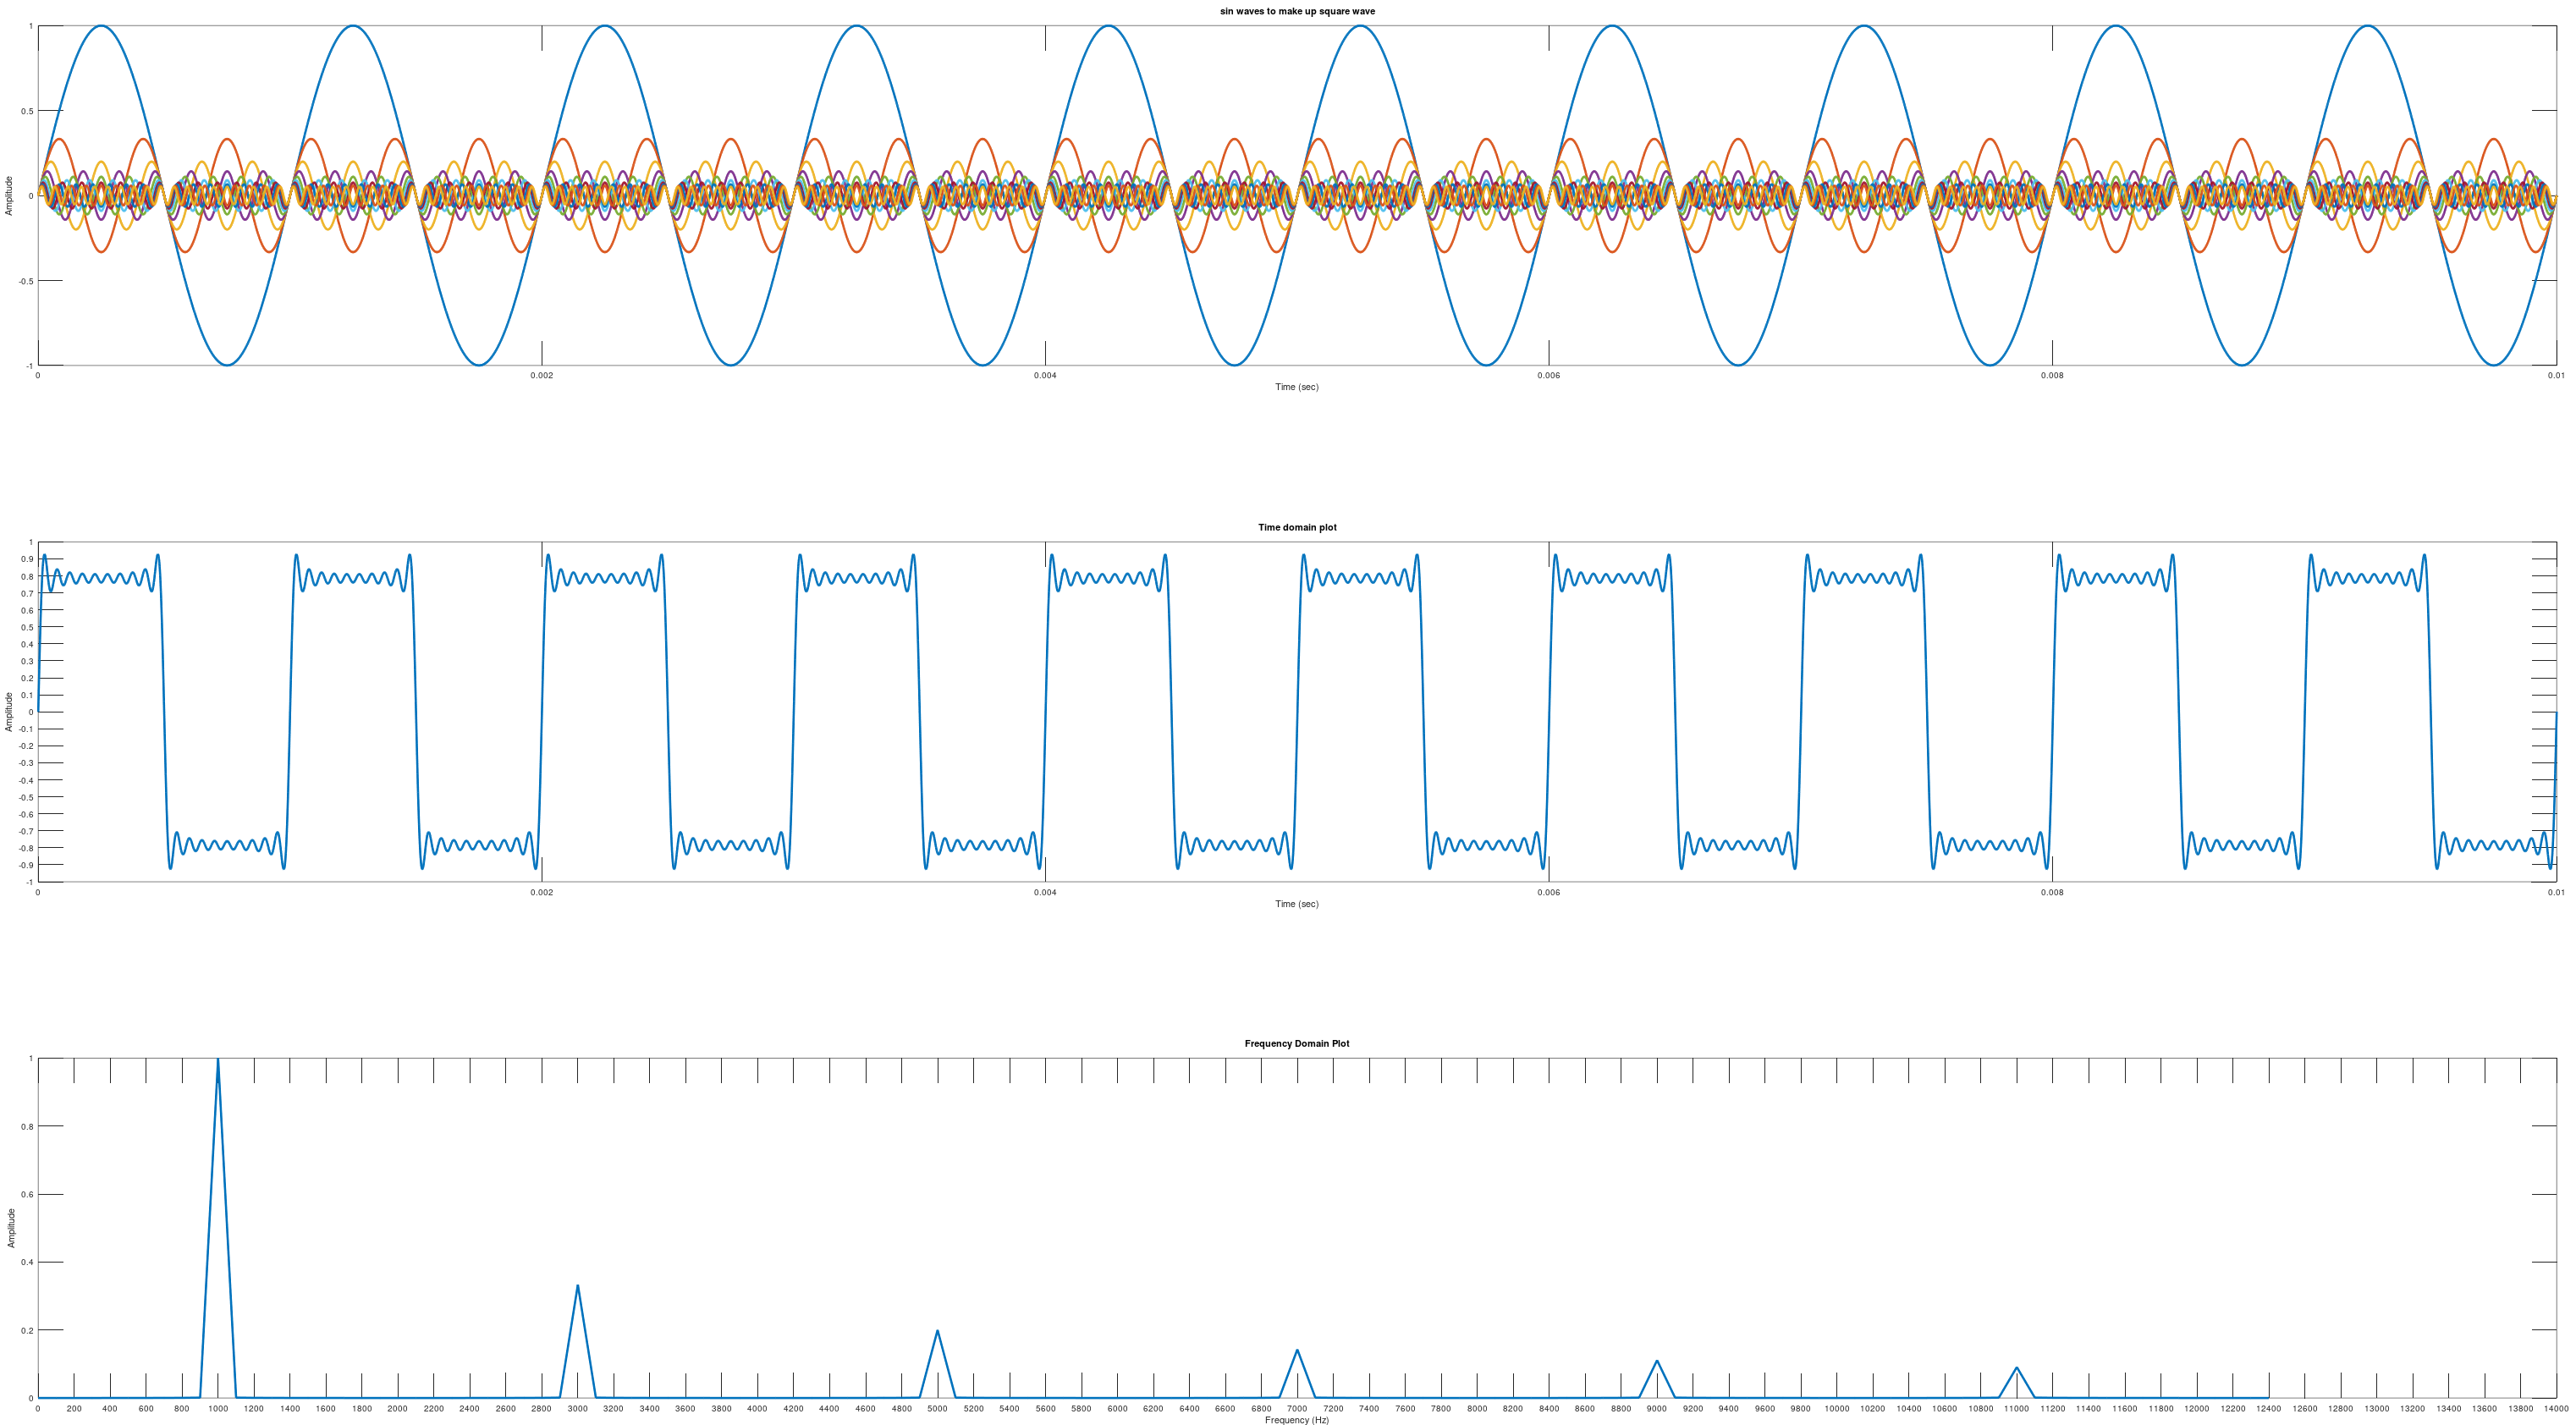
To get a more perfect square wave just increase the number for numberofsinewaves.