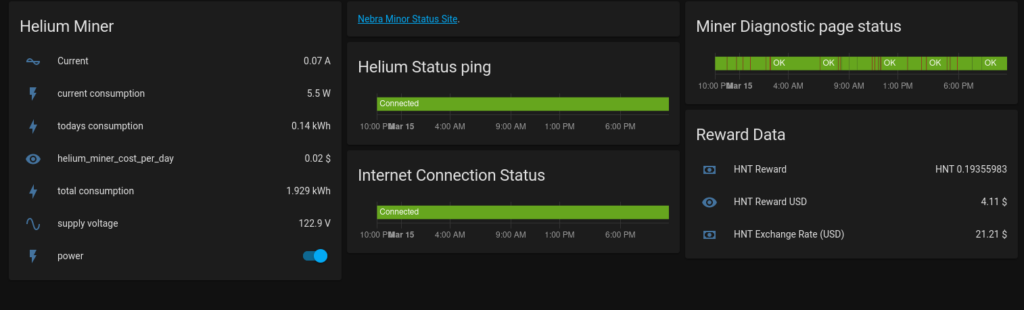
This post will go over how to create a dashboard similar to the one shown in Figure 1. Some features shown on this dashboard are not possible without some additional hardware or external configuration: power usage/cycling and Nebra Dashboard Page. Due to this I will not be covering these in this blog post.
This tutorial assumes that you are using debian. If you are using a different OS some commands maybe different. My host system is a RPI running raspbian based on debian 10. All YAML settings provided should be added to ~/.homeassistant/configuration.yaml or wherever the home assistant config file is stored. (HA Doc)
All binary_sensor/sensor entities should be placed under one header. I place the header on all of the settings to allow copy+paste but HA will complain if duplicate headers are used in the config file.
First make sure the Nebra Hostspot has a static IP address which is most easily done by registering its mac address to the DHCP server, rather than setting a static IP on the Hotspot itself.
Helium Status Ping:
The easiest setup is the Status Ping test which pings the Hotspot every 60 seconds to provide a quick glance of the status. This setting comes in handy as sometimes the diagnostic page will go down but the Hotspot is still up or installing updates. If the Hotspot stops responding to pings it likely needs to be power cycled.
binary_sensor:
# helium miner ping status
    - platform: ping
      host: <Miner IP>
      scan_interval: 60
      name: 'Helium Miner Ping Status'
Internet Connection Status:
The internet connection status indicator is similar to the Nebra Hotspot Ping Status but pings an external IP rather than a local IP. In this example google DNS is used but any external IP that is always up will work.
binary_sensor:
# Ping google to get internet status
    - platform: ping
      host: 8.8.8.8
      scan_interval: 30
      name: 'Internet Status'
Reward Data:
The following code will add reward information (rolling every 24 hours). Make sure to modify the <HotspotID> to your Hotspot ID. The Hotspot ID can be obtained by from the helium explorer page:
https://explorer.helium.com/hotspots/<HotspotID>Note: The User-Agent is important or the API will block the connection.
sensor:
# helium reward
    - platform: rest
      resource: https://api.helium.io/v1/hotspots/<HotspotID>/rewards/sum?min_time=-1%20day
      method: GET
      name: nebra_reward_hnt
      device_class: monetary
      value_template: '{{ value_json.data.total }}'
      unit_of_measurement: "HNT"
      scan_interval: 300
      headers:
              User-Agent: Mozilla/5.0 (X11; Ubuntu; Linux x86_64; rv:96.0) Gecko/20100101 Firefox/96.0
#price of HNT to USD
    - platform: rest
      resource: https://api.helium.io/v1/oracle/prices/current
      method: GET
      name: hnt_to_usd
      device_class: monetary
      value_template: >-
              {{ value_json.data.price/100000000 }}
      unit_of_measurement: "$"
      scan_interval: 300
      headers:
              User-Agent: Mozilla/5.0 (X11; Ubuntu; Linux x86_64; rv:96.0) Gecko/20100101 Firefox/96.0
# HNT reward to USD
    - platform: template
      sensors:
        nebra_reward_usd:
          unit_of_measurement: "$"
          value_template: >-
            {{ (float(states('sensor.nebra_reward_hnt'))*float(states('sensor.hnt_to_usd'))) | round(2) }}
Miner Diagnostic Page Status:
Here is where the power of home assistant really comes in. HA can download and parse the internal status page of the Hotspot and report if there is an issue. This can be great for tracking uptime. Of course as stated before the status page can go down and still have the Hotspot functioning but if the status page goes down for over an hour it is likely an issue. This will likely become more important after the Light Hotspot transition is rolled out.
binary_sensor:
    - platform: rest
      resource: http://<Miner IP>/json
      method: GET
      name: nebra_diag_status
      device_class: problem
      value_template: >-
              {% if value_json.PF == true %}
                 false
              {% else %}
                 true
              {% endif %}
That is it for the configuration.yaml file!
You can now login to the HA website and configure the indicators how you wish. The ones shown in the original snapshot are not special but I will list them below. These do NOT get placed in the configuration.yaml file!
Helium Status Ping:
entities:
  - entity: binary_sensor.helium_miner_ping_status
hours_to_show: 24
refresh_interval: 0
title: Helium Status ping
type: history-graph
Internet Connection Status:
entities:
  - entity: binary_sensor.internet_status
hours_to_show: 24
refresh_interval: 0
type: history-graph
title: Internet Connection Status
Miner Diagnostic Page Status:
type: history-graph
entities:
  - entity: binary_sensor.nebra_diag_status
hours_to_show: 24
refresh_interval: 0
title: Miner Diagnostic page status
Reward Data:
type: entities
entities:
  - entity: sensor.nebra_reward_hnt
    name: HNT Reward
  - entity: sensor.nebra_reward_usd
    name: HNT Reward USD
  - entity: sensor.hnt_to_usd
    name: HNT Exchange Rate (USD)
title: Reward Data